For any business that relies on online visibility, this is the most important question you can ask.
Unfortunately, many small and medium-sized businesses only ask it after leads slow down or sales drop.
The reality is simple:
If your website is part of your sales or marketing strategy, its performance should be measurable, understood, and monitored regularly.
The good news? Google provides free tools that make this surprisingly easy — and they form the foundation of any effective search engine optimisation (SEO) strategy.
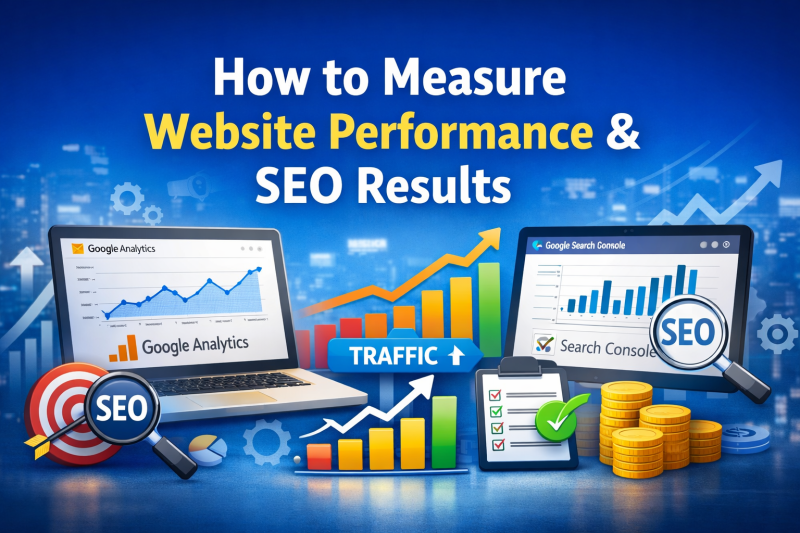
The Two Tools That Tell You Everything You Need to Know
Google gives website owners access to two essential platforms that support long-term SEO success:
Google Search Console
Search Console shows how your website appears in Google search results. It helps you understand:
-
Which search terms trigger your site
-
How often people click your pages
-
Whether Google can crawl and index your content
-
Technical issues such as errors, mobile usability, and page experience warnings
This data is essential for technical SEO improvements and identifying ranking opportunities — all core elements of a professional SEO service.
Google Analytics
Google Analytics focuses on what users do once they arrive on your website:
-
How many visitors you receive
-
Where they come from
-
Which pages they view
-
How long they stay
-
Whether they convert, leave, or engage further
Together, Search Console and Analytics allow an SEO agency to diagnose visibility issues, user behaviour problems, and conversion blockers.
How Do I Set Them Up?
Both tools are free and relatively simple to install.
-
Google Analytics requires a tracking code to be added to your website. Once installed, it begins collecting data immediately (it cannot show historical data).
-
Google Search Console requires site verification to ensure only authorised users can access search performance data.
If your website was built professionally, both should already be in place. If not, they can be configured quickly as part of a proper SEO audit and setup process.
The Two KPIs Every Business Owner Must Understand
While these platforms offer advanced reporting, most SMBs only need to track two core metrics consistently to understand whether their SEO is working.
1. Website Traffic (Users)
Traffic measures how many people visit your website over a given period.
More importantly, it shows where those users come from.
The main traffic sources:
-
Organic – Users who found you through Google search (directly linked to SEO performance)
-
Direct – People who already know your brand and typed your website directly
-
Referral – Visitors who clicked links from other websites (backlinks)
-
Social – Traffic from platforms like Facebook, Instagram, or LinkedIn
-
Email – Users arriving from email campaigns
-
Paid – Visitors from advertising such as Google Ads
For most businesses, organic traffic is the most valuable, as it represents users actively searching for your products or services. Increasing organic traffic is the primary objective of any well-structured SEO campaign.
Tracking traffic trends monthly quickly shows whether your SEO strategy is producing real results.
2. Bounce Rate (And Why It’s Often Misunderstood)
Bounce rate measures single-page sessions — visitors who arrive on one page and leave without triggering another tracked interaction.
Important clarification:
-
Bounce rate does not measure time spent
-
A user can spend several minutes reading a page and still count as a bounce
When a high bounce rate is normal:
-
Service pages where users call immediately
-
Contact pages
-
Informational blog posts designed to answer a single question
When a high bounce rate is a problem:
-
Ecommerce product pages
-
Lead generation landing pages
-
Booking or enquiry funnels
This is where conversion rate optimisation (CRO) overlaps with SEO — driving traffic is pointless if users leave without taking action.
Turning SEO Data Into Business Decisions
Understanding your Search Console and Analytics data allows you to:
-
Measure ROI from SEO services
-
Identify underperforming pages
-
Improve user experience and page structure
-
Increase enquiries, calls, and conversions
-
Make informed marketing decisions instead of guessing
A successful website is not just about rankings — it is about visibility, engagement, and conversion, all supported by SEO-driven insights.
Why This Matters More Than Ever
If you don’t understand how your website is performing:
-
You cannot tell if SEO is working
-
You cannot justify your marketing spend
-
You cannot improve conversions
-
You cannot scale your online presence
Businesses that monitor SEO performance consistently outperform those that rely on assumptions.
Final Takeaway
If your website is important to your business, its performance must be visible and measurable.
Google Search Console tells you how people find you through search engines.
Google Analytics tells you what they do once they arrive.
Together, these tools form the foundation of effective SEO services, smarter decision-making, and sustainable online growth.
How to Measure Website Performance FAQs
What metrics should I monitor to know if my website is working?
Start with organic traffic, enquiries/conversions, bounce rate (in context), engagement time, and top landing pages. Track trends monthly, not day-to-day noise.
What is the difference between Google Analytics and Google Search Console?
Google Analytics tells you what visitors do on your site (traffic sources, behaviour, conversions). Google Search Console shows how your site performs in Google Search (queries, impressions, clicks, indexing, and technical search issues).
How do I know if SEO is improving my results?
Look for growth in impressions and clicks for relevant queries, more organic traffic to key service pages, and increased enquiries/conversions from organic search over time.
Why can my traffic go up but enquiries stay the same?
Usually the traffic is misaligned (wrong keywords), the landing page isn’t persuasive, the CTA is weak, or tracking is missing. This is where conversion rate optimisation (CRO) and intent-focused SEO make the difference.
Is a high bounce rate always bad?
No. A high bounce rate can be normal for pages that answer a question quickly or drive phone calls. It’s more concerning for ecommerce, booking funnels, or landing pages that should push users to the next step.
How often should I check Search Console and Analytics?
Weekly for quick health checks (errors, indexing, sudden drops). Monthly for performance decisions (content priorities, SEO wins, conversion improvements).
What should I do first if rankings or traffic drop?
Check Google Search Console for manual actions, indexing problems, or coverage errors. Then review recent site changes, page speed, content updates, and competitor movement before making major changes.
Do I need a professional to set this up properly?
If you want accurate ROI tracking, goal/conversion setup, call tracking, and clean reporting, yes. Misconfigured tracking leads to wrong decisions and wasted SEO budget.